
Technical Due Diligence Framework for M&A
1. Strategic Context: The Evolution of Technical Assurance in M&A
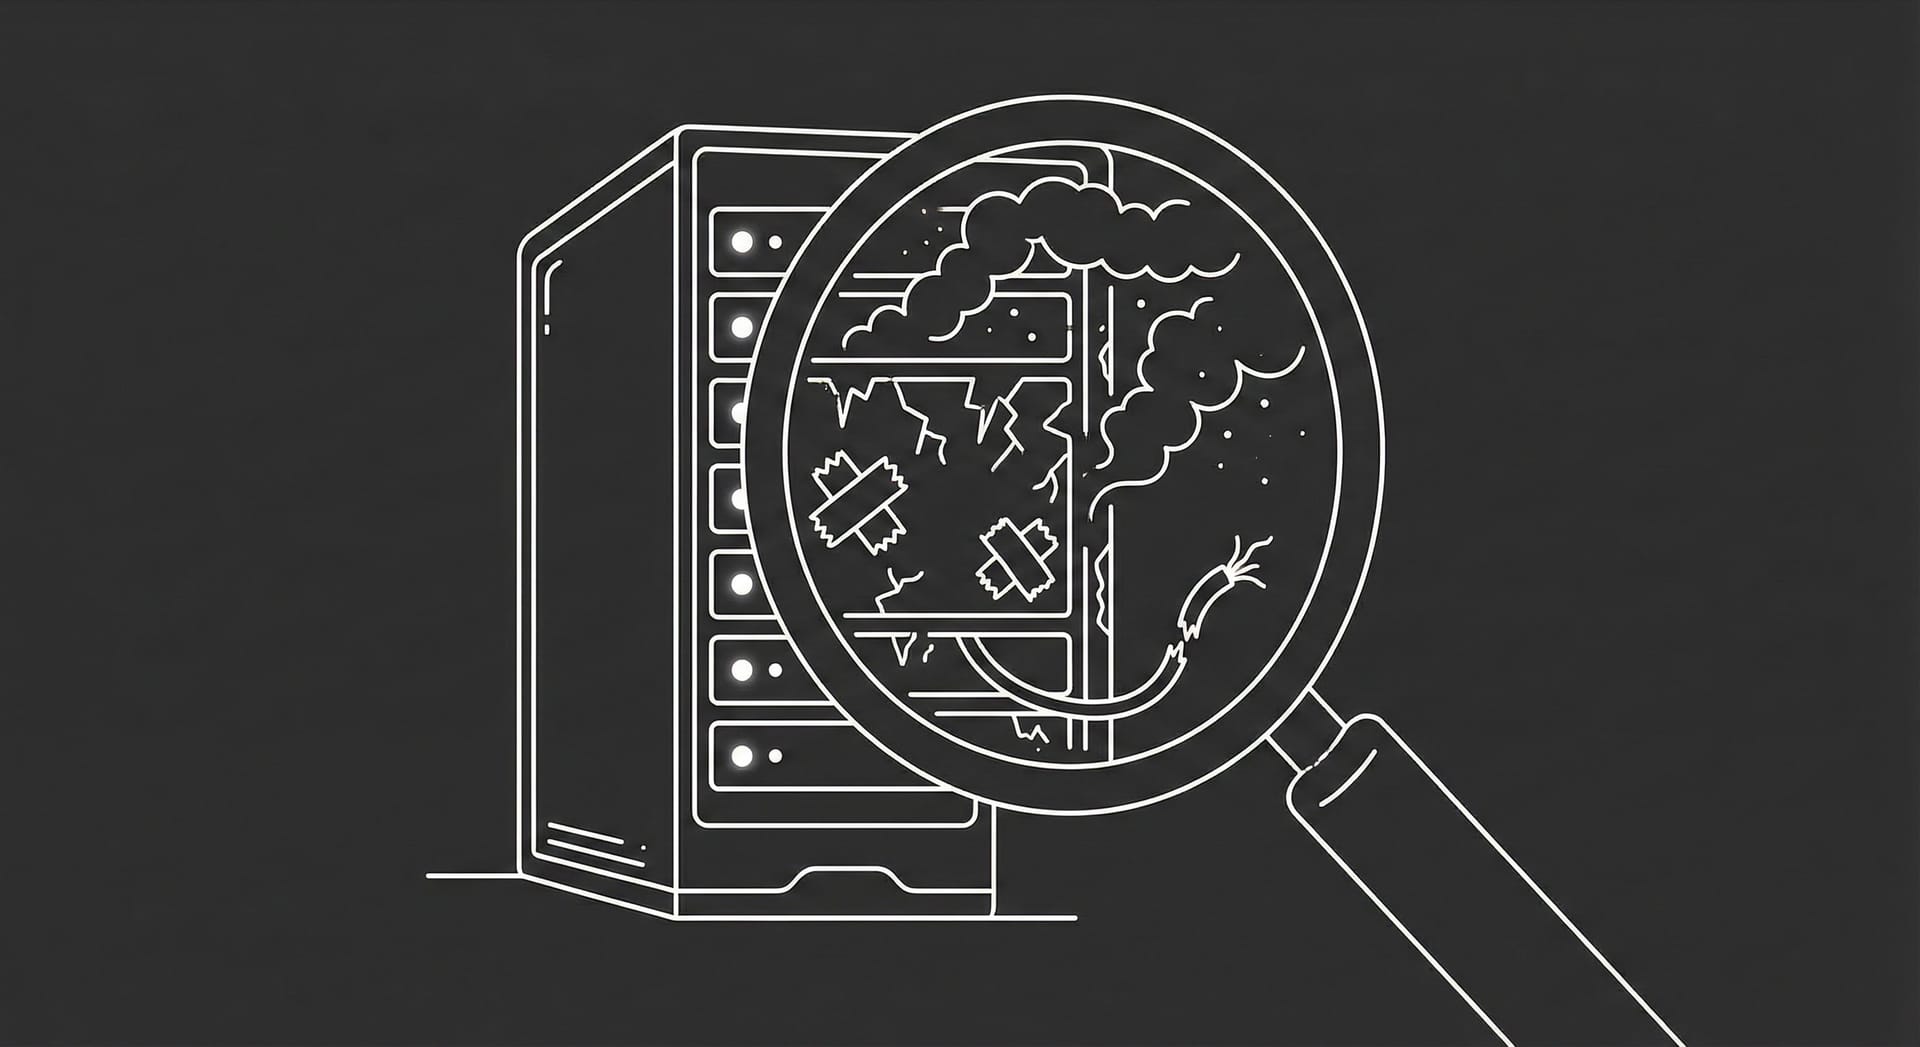
In the contemporary landscape of global Mergers and Acquisitions (M&A), the role of Technology Due Diligence (Tech DD) has undergone a fundamental paradigm shift. Historically viewed as a subsidiary operational check—a mere inventory of hardware assets and software licenses—Tech DD has ascended to a primary determinant of deal valuation, structure, and post-close viability. As digital transformation permeates every industry, the distinction between "technology companies" and "traditional enterprises" has effectively dissolved; in the modern economy, every acquisition is, to varying degrees, a technology acquisition. Consequently, the risks associated with technical debt, architectural obsolescence, intellectual property (IP) encumbrances, and cybersecurity vulnerabilities are no longer confined to the IT department. They are existential threats to the investment thesis itself, capable of eroding equity value, stalling integration, and precipitating regulatory catastrophes.
This comprehensive report provides an exhaustive framework for conducting expert-level Technology Due Diligence. It is designed not merely to identify "red flags" but to provide a granular, multi-dimensional analysis of the target asset's technical health. The objective is twofold: Defensive Assurance, ensuring that the acquirer is not inheriting unquantified liabilities (e.g., "spaghetti code," non-compliant open-source usage, or latent security breaches); and Offensive Value Creation, identifying hidden leverage points—such as scalable proprietary algorithms, high-velocity engineering cultures, or untapped data assets—that justify premium valuations and support aggressive growth strategies.
The methodology detailed herein transcends superficial checklist validation. It employs a rigorous, forensic approach to analyze the second and third-order implications of technical decisions. For instance, high cloud costs are not just an operational expense but a signal of poor architectural design (e.g., inefficient single-tenant setups) or immature FinOps practices, which in turn impacts Gross Margins and the company's valuation multiple. Similarly, a high rate of manual testing is not just a QA issue; it is a leading indicator of slow release velocity, reduced agility, and high future labor costs. By synthesizing these diverse data points—from code complexity metrics to SaaS unit economics—this framework empowers acquirers to model integration costs accurately, forecast necessary Capital Expenditures (CapEx), and structure definitive agreements with appropriate representations, warranties, and indemnities.
2. Software Architecture and System Design Integrity
The architectural foundation of a target company is the single most critical predictor of its long-term agility, scalability, and maintainability. A target may possess a compelling product with strong market fit, but if the underlying architecture is brittle or unscalable, the cost of future growth will be prohibitive. The due diligence process must therefore probe beyond the "PowerPoint architecture" presented by management to reveal the "deployed reality."
2.1 Architectural Patterns: The Scalability Spectrum
The assessment must first classify the system's architecture and evaluate its appropriateness for the company's stage and growth trajectory. While modern trends favor distributed systems, simplicity often trumps complexity in early stages. The risk arises when the architecture is misaligned with the business scale.
2.1.1 Monolithic vs. Microservices
The transition from monolithic architectures to microservices is a common narrative in scaling companies. However, a premature or poorly executed migration often results in the dreaded "Distributed Monolith." This anti-pattern occurs when services are technically separated (running on different servers/containers) but remain logically coupled. For example, if Service A cannot function without a synchronous real-time response from Service B, or if both services share a single database schema, the system incurs all the operational complexity of microservices (latency, deployment coordination, observability challenges) without achieving the benefits of independent scaling and deployment.
Table 1: Architectural Patterns and Associated Risks
2.1.2 Scalability Mechanisms
The diligence team must interrogate the mechanism of scalability. Does the system rely on Vertical Scaling (adding more CPU/RAM to a single server)? This is a significant red flag for high-growth targets, as it imposes a hard physical limit on capacity (the "ceiling" of the largest available instance). True scalability requires Horizontal Scaling (adding more nodes), which necessitates a stateless application layer. If the application stores session data on the local file system rather than a distributed cache (e.g., Redis), it cannot scale horizontally.
2.2 Database Architecture and Data Integrity
The data layer is frequently the primary bottleneck in scaling applications. Unlike stateless application servers, databases have "gravity"—they are difficult to move, split, or refactor without significant downtime and risk.
2.2.1 Schema Design and Anti-Patterns
A critical assessment area is the database schema design. In relational databases (RDBMS), a common anti-pattern is the "One-Size-Fits-All VARCHAR" trap, where developers use generic text fields for structured data, bypassing the database's integrity checks. Even more prevalent in modern stacks is the abuse of JSONB columns within PostgreSQL to store core business entities. While flexible, this "schema-less" approach inside a relational engine sacrifices foreign key integrity and query optimization, leading to data consistency issues at scale.
Furthermore, the diligence process must identify the "Shared Database" anti-pattern in microservices environments. If multiple microservices read and write to the same database tables, they are tightly coupled. A schema change required by one service (e.g., the Billing Service) could break another service (e.g., the User Profile Service), paralyzing development velocity.
2.2.2 Scalability and Performance Indicators
Reviewers should request slow query logs and database performance metrics. The presence of "N+1 Query" problems—where the application executes a separate database query for every item in a list—indicates a lack of Object-Relational Mapping (ORM) optimization, which will cripple performance under load. Additionally, reliance on complex Materialized Views that require manual or fragile orchestration to refresh suggests that the underlying data model is inefficient for the required read patterns. If the business relies on "stale" data because real-time queries are too slow, this operational constraint must be factored into the technical debt assessment.
2.3 Legacy Systems and End-of-Life (EOL) Risks
Many established targets will possess legacy components. The risk is not the age of the code, but its supportability. Diligence must identify any software or hardware that has reached or is approaching End of Life (EOL). EOL systems receive no security patches, making them compliant targets for cyberattacks. For example, a core platform running on Python 2.7 (EOL since 2020) or an outdated version of CentOS requires an immediate, non-negotiable remediation project post-close. This "forced upgrade" is a direct capital cost that must be deducted from the deal valuation.
3. Codebase Quality, Technical Debt, and Maintainability
Technical debt is a financial liability that does not appear on the balance sheet but manifests as increased maintenance costs, reduced feature velocity, and lower system stability. Quantifying this debt requires moving beyond subjective developer interviews to objective, data-driven analysis of the source code.
3.1 Quantitative Code Metrics
A rigorous diligence process employs static code analysis tools (e.g., SonarQube, Coverity, CAST) to generate objective metrics regarding the health of the codebase.
3.1.1 Cyclomatic Complexity
Cyclomatic Complexity measures the number of linearly independent paths through a program's source code (essentially, the number of decision points like if, for, while, case). It is a proxy for testability and maintainability.
- 1-10: Low risk; simple, testable code.
- 11-20: Moderate risk; requires more rigorous testing.
- 21-50: High risk; complex code that is difficult to maintain and likely contains bugs.
- >50: Red Flag. Code is effectively "untestable" and dangerously complex. Refactoring is mandatory.
High cyclomatic complexity often correlates with "Spaghetti Code"—logic that is tangled and unstructured. If the core "secret sauce" algorithm of the target company has a complexity score of 75, it represents a massive key-person risk; likely only the original author understands it, and any attempt to modify it will introduce regressions.
3.1.2 Halstead Metrics and Maintainability Index
Beyond complexity, Halstead metrics (Volume, Effort, Difficulty) provide insight into the cognitive load required to understand the code. A low Maintainability Index (typically <65 on a scale of 0-100) indicates code that is "fragile"—fixing one bug is likely to create two more. This metric directly informs the "Cost to Maintain" assumptions in the post-merger P&L model.
3.2 Test Coverage and QA Maturity
The maturity of the Quality Assurance (QA) process is a strong predictor of engineering velocity. The assessment should focus on the Test Pyramid: a healthy organization has a broad base of automated Unit Tests, a smaller layer of Integration Tests, and a minimal cap of End-to-End (UI) Tests.
- Inverted Pyramid (Ice Cream Cone): If the target relies primarily on manual testing or fragile UI automation (e.g., Selenium scripts that break with every CSS change), this is a red flag. It implies that release cycles are slow, expensive (linear scaling of QA headcount), and prone to human error.
- Coverage Metrics: While "100% coverage" is a vanity metric, coverage below 50-60% on business-critical logic suggests that the team is flying blind. Diligence must verify not just the quantity of tests, but their quality—do assertions actually check for correctness, or do they just ensure the code doesn't crash?
3.3 Dependency Management and Supply Chain Security
Modern software is assembled, not just written; often 80-90% of a codebase consists of third-party open-source libraries. Diligence must utilize Software Composition Analysis (SCA) tools to audit these dependencies.
- Security Vulnerabilities: The presence of critical vulnerabilities (CVEs) in libraries (e.g., unpatched Log4j or OpenSSL versions) indicates poor security hygiene and a negligent patching culture.
- Dependency "Rot": If a significant portion of the libraries are multiple major versions behind, the "upgrade tax" will be substantial. Upgrading a core framework (e.g., React, Angular, Rails) from a version several years old is often a rewriting exercise, not a patching one.
4. Infrastructure, Cloud Operations, and FinOps
As companies migrate to the cloud, infrastructure costs have shifted from CapEx (buying servers) to OpEx (monthly cloud bills), directly impacting Gross Margins. A Tech DD process must rigorously evaluate "Cloud Unit Economics" to ensure the business model is sustainable at scale.
4.1 Cloud Architecture and Tenancy Models
The infrastructure review must determine the tenancy model—Single Tenant vs. Multi-Tenant—and its economic implications.
- Single Tenant (Hosted): Each customer gets their own database/server instance. This offers high isolation but poor economies of scale. Infrastructure costs grow linearly with customer count, capping margins.
- Multi-Tenant (SaaS): Customers share resources. This offers high margin potential but requires rigorous software-level isolation to prevent data leakage.
- Red Flag: A SaaS company claiming "high margins" but running a single-tenant architecture disguised as multi-tenant (e.g., spinning up a new container cluster for every $500/month client) will face a "margin wall" as they scale.
4.2 FinOps: Cloud Unit Economics
FinOps is the operating model for the cloud, bringing financial accountability to the variable spend model of cloud computing. The diligence team must assess the target's FinOps maturity level:
- Crawl: No tagging; total monthly bill is the only metric.
- Walk: Costs allocated by team/project; some use of Reserved Instances (RIs) or Savings Plans.
- Run: Unit economics fully defined (e.g., "Cost per API Call," "Cost per Active User").
Key Metric: Cloud Unit Economics.
A red flag exists when cloud costs grow faster than revenue. In a healthy SaaS business, the "Cost of Goods Sold" (COGS) component related to hosting should decrease as a percentage of revenue over time due to economies of scale. If the target cannot produce a "Cost Per Tenant" metric, it suggests a lack of visibility that will complicate post-merger integration and margin optimization.
4.3 Operational Resilience and Disaster Recovery (DR)
Infrastructure diligence must verify the system's resilience to failure. This involves reviewing Business Continuity Plans (BCP) and Disaster Recovery (DR) protocols.
- The "Paper Plan" Fallacy: The existence of a DR plan document is insufficient. Evidence of testing is required. A company that has not conducted a DR simulation or "Game Day" in the last 12 months essentially has no proven recovery capability.
- RTO/RPO Misalignment: Reviewers must assess the Recovery Time Objective (RTO) (how long to get back up) and Recovery Point Objective (RPO) (how much data can we lose). If a target contracts for a 1-hour RPO but relies on nightly snapshots (implying up to 24 hours of data loss), there is a contractual liability waiting to happen.
5. Cybersecurity, Governance, and Data Privacy
In the era of GDPR, CCPA, and industrialized ransomware, cybersecurity diligence is paramount. A breach history or lax security posture can result in massive regulatory fines, reputational damage, and the direct loss of IP, fundamentally altering the deal's economics.
5.1 Security Governance Frameworks
The assessment should begin with the target's adherence to recognized security frameworks (e.g., SOC 2, ISO 27001, NIST). However, possession of a certificate is not proof of security.
- SOC 2 Nuance: Diligence must review the exceptions noted in SOC 2 Type II reports. A report with numerous "qualified opinions" or exceptions indicates a control environment that exists on paper but fails in practice.
- Vendor Risk Assessment (SIG vs. CAIQ): For vendor risk management, the distinction between using a SIG Lite vs. a CAIQ questionnaire is relevant. The CAIQ (Consensus Assessments Initiative Questionnaire) is specific to cloud security controls (Cloud Controls Matrix), whereas the SIG (Standardized Information Gathering) covers a broader spectrum of enterprise risks including HR, physical security, and business continuity. A target that only uses a CAIQ might be missing broader enterprise risk controls.
5.2 Vulnerability Management and Penetration Testing
Acquirers must request the most recent third-party penetration test reports.
- Recurrent Vulnerabilities: The same high-severity issues appearing in consecutive annual reports indicate a broken remediation process.
- Scope Limitations: If the pentest excluded key APIs, legacy modules, or mobile apps, the report provides a false sense of security.
- Network Boundaries: A "flat network" where development, testing, and production environments are interconnected allows attackers to pivot easily. Diligence should look for clear segmentation and "Zero Trust" principles.
5.3 Data Privacy (GDPR/CCPA)
Data privacy diligence focuses on the lawful basis of data processing. A target company must demonstrate not just that they protect data, but that they have the legal right to possess and use it. This is particularly critical in M&A, where the transfer of customer data to a new entity (the acquirer) may trigger consent requirements.
- Record of Processing Activities (RoPA): Does the company maintain a RoPA as required by GDPR?
- Data Minimization: Are there data retention policies in place, and are they automated? Hoarding data indefinitely is a liability, increasing the blast radius of any potential breach.
- Test Data Management: Using production data in testing environments without anonymization/masking is a major compliance violation.
6. Intellectual Property (IP) and Legal Compliance
For technology companies, the source code and data are the business. IP diligence ensures the target actually owns what it is selling and that the asset is not encumbered by legal risks that could compel the open-sourcing of proprietary technology.
6.1 Chain of Title and Assignment
The "Chain of Title" verification is the legal bedrock of the deal. Every line of code must be traceable to a valid transfer of rights.
- PIIAA Gaps: A common deal-breaker is the absence of "Proprietary Information and Inventions Assignment Agreements" (PIIAA) for early founders, contractors, or interns. If a core algorithm was written by a contractor who never signed an assignment agreement, that individual could theoretically claim ownership of the IP, holding the acquisition hostage.
- Acqui-hire Risks: If the target previously acquired other companies, diligence must confirm that those assets were properly assigned to the target entity.
6.2 Open Source Licensing (Copyleft Risk)
The integration of open-source software (OSS) is standard, but the type of license matters.
- Copyleft Licenses (GPL/AGPL): These "viral" licenses require that any derivative work or software linked to the library also be released as open source. If a target's proprietary commercial product statically links to a GPL library, the entire product's IP could be compromised.
- The AGPL Trap: The Affero GPL (AGPL) is particularly dangerous for SaaS companies. Unlike standard GPL, which triggers upon "distribution," AGPL triggers if the software is interacted with over a network. Diligence must utilize automated scanning (e.g., Black Duck, Snyk) to identify any AGPL components.
7. Engineering Organization, Culture, and Process
Technology is built by people. Understanding the engineering culture, velocity, and talent density is crucial for post-merger retention and integration. A "toxic" engineering culture can lead to a mass exodus of talent immediately following the acquisition, destroying the deal's value.
7.1 Productivity Metrics (DORA)
Quantitative assessment of engineering performance should rely on the DORA (DevOps Research and Assessment) metrics, which are empirically linked to high-performing organizations:
- Deployment Frequency: How often is code released? (Elite = On-demand/multiple times per day).
- Lead Time for Changes: Time from commit to production. (Elite = Less than one hour).
- Change Failure Rate: Percentage of deployments causing failure. (Elite = 0-15%).
- Time to Restore Service: Time to recover from failure. (Elite = Less than one hour).
Low scores in these metrics indicate a "Feature Factory" mindset where speed is prioritized over stability, or conversely, a bureaucratic culture where fear of failure paralyzes release velocity.
7.2 Cultural Assessment and "Fake Agile"
Culture is often described as "how things get done when management isn't looking." A significant risk is "Fake Agile"—teams that perform the rituals (Stand-ups, Sprints) but lack the empirical feedback loops and adaptability of true Agile.
- Signs of Fake Agile: Rigid long-term roadmaps (waterfall in disguise); lack of retrospectives; isolated cross-functional silos (Dev vs. QA vs. Ops); management focusing on "velocity points" rather than value delivered.
- Cultural Toxicity: Diligence should look for signs of "Blame Culture" or "Flying Monkeys" (groups manipulated by toxic leaders to target others). High turnover rates (>20%) or the tolerance of "Brilliant Jerks" (technically skilled but culturally destructive individuals) are major red flags that predict post-close attrition.
7.3 Key Person Risk and Knowledge Management
Acquirers must identify "Tower of Knowledge" individuals—engineers who are the sole repositories of critical system understanding. If the architecture documentation is non-existent and knowledge is tribal, the loss of these key individuals is catastrophic. Diligence should assess the "Bus Factor" for critical components and verify the existence of up-to-date documentation (wikis, architectural diagrams, runbooks).
8. Financial Alignment and SaaS Unit Economics
Finally, technical diligence must bridge the gap to financial diligence. Technology choices directly impact the Profit and Loss (P&L) statement, specifically Cost of Goods Sold (COGS) and Gross Margins.
8.1 COGS Accuracy and Gross Margin Analysis
For SaaS companies, Gross Margin is a primary valuation driver.
- Benchmarks: Top-performing SaaS companies achieve gross margins of 80%+. A margin below 70% is a red flag.
- Root Causes of Low Margins: Inefficient single-tenant architectures; poor cloud optimization; heavy reliance on human labor for onboarding/support (which should be automated); or "Consulting-ware" (software that requires heavy customization per client).
- COGS Dumping: Diligence must scrutinize the P&L to ensure hosting/support costs are not being hidden in R&D (Operating Expense). Misclassifying these costs inflates Gross Margin artificially.
8.2 The Rule of 40
The "Rule of 40" (Growth Rate + Profit Margin > 40%) is a standard benchmark for SaaS health. Tech DD contributes to this analysis by identifying if the "Profit" component is suppressed by excessive R&D spending due to low developer productivity or high technical debt maintenance costs. If a company has high growth but abysmal margins due to cloud inefficiencies, the Tech DD team identifies the "optimization lever" available to the PE firm post-acquisition.
9. The Master Technology Due Diligence Checklist
The following checklist synthesizes the framework into actionable verification steps.
A. Architecture & Scalability
- [ ] Architecture Classification: Define system as Monolith, Microservices, or Hybrid. Identify "Distributed Monolith" risks.
- [ ] Scalability Stress Test: Review load test results (JMeter/Gatling). Confirm horizontal scaling capability.
- [ ] Database Audit: Check for "N+1" queries, shared database anti-patterns, and lack of indexing.
- [ ] Legacy Inventory: List all EOL software/hardware (e.g., Python 2.x, CentOS 6).
- [ ] Tenancy Model: Verify true multi-tenancy vs. single-tenant hosting.
B. Code Quality & Technical Debt
- [ ] Static Analysis: Run tools (SonarQube) for Cyclomatic Complexity (>50 is critical fail).
- [ ] Maintainability Index: Check Halstead metrics; score <65 requires remediation.
- [ ] Dependency Scan: Run SCA (Snyk/Black Duck) for vulnerability and license risks.
- [ ] Test Coverage: Verify unit/integration test ratio (Test Pyramid).
- [ ] Dead Code Analysis: Review commit history for zombie features.
C. Infrastructure & Cloud FinOps
- [ ] Asset Inventory: Comprehensive list of all servers, buckets, and 3rd party services.
- [ ] Cloud Spend Unit Economics: Calculate "Cost per Tenant" or "Cost per Transaction."
- [ ] Tagging Compliance: Verify % of cloud assets with proper cost-allocation tags.
- [ ] DR Drill Evidence: Request logs/reports from the last disaster recovery simulation.
- [ ] Uptime Verification: Compare internal logs (Datadog) vs. public status pages vs. SLAs.
D. Security & Governance
- [ ] Framework Compliance: Request SOC 2 Type II, ISO 27001, HIPAA reports. Check exceptions.
- [ ] Pentest History: Review last 2 years of external pentests. Check for recurrent issues.
- [ ] Vendor Risk: Review SIG/CAIQ questionnaires for top 5 critical vendors.
- [ ] Privacy (GDPR/CCPA): Verify RoPA, privacy policy, and data deletion workflows.
- [ ] Access Control: Audit MFA enforcement and admin privilege distribution.
E. IP & Legal
- [ ] PIIAA Audit: 100% verification of signed assignment agreements for all contributors.
- [ ] Open Source License Audit: Check for Copyleft (GPL/AGPL) in distributed/SaaS code.
- [ ] Domain/Trademark: Verify ownership of all digital properties.
F. Team & Culture
- [ ] DORA Metrics: Request data on Deployment Frequency, Lead Time, Failure Rate, MTTR.
- [ ] Org Structure: Review "Bus Factor" for key systems.
- [ ] Turnover Rate: Analyze attrition trends (Voluntary vs. Involuntary) over last 24 months.
- [ ] Agile Maturity: Inspect Sprint Retrospectives for evidence of continuous improvement.
G. Financial Alignment
- [ ] Gross Margin Analysis: Validate COGS components (Hosting, Support, Implementation).
- [ ] CapEx Forecast: Project hardware refresh and license renewal costs for 3 years.
- [ ] Software Licenses: Review transferability of major enterprise contracts (Oracle, Salesforce).
Complete Technical Due Diligence Checklist
Conclusion
Technical Due Diligence is the bridge between the technical reality of an asset and its commercial value. By systematically interrogating the architecture, code quality, infrastructure economics, and engineering culture, acquirers can transform uncertainty into calculated risk. This framework ensures that no "black boxes" remain, empowering stakeholders to proceed with confidence, adjust valuations based on empirical data, and execute integration plans that preserve and accelerate value creation.
No spam, no sharing to third party. Only you and me.


Member discussion