
Forged Reality: When KPIs Lie to You

There is a moment in every failed project where the Project Manager stands up, points to a dashboard, and says: "But the metrics were green until yesterday."
This is the Dashboard Illusion.
As executives, we crave control. Since we cannot physically watch every line of code being written or every support ticket being answered, we build abstractions. We build Dashboards, KPIs, and OKRs. We build a Map of the organization.
But as the philosopher Alfred Korzybski famously warned: "The map is not the territory."
When the Map (your KPI dashboard) disagrees with the Territory (customer reality), the organization usually tries to fix the Map. They tweak the formula. They adjust the threshold.
They should be looking out the window.
Here is why your metrics are lying to you, and the philosophical razors you need to see the truth.
1. Goodhart’s Law (The Cobra Effect)
The most fundamental law of management is Goodhart’s Law:
"When a measure becomes a target, it ceases to be a good measure."
Once you attach a bonus or a performance review to a metric, the organization will optimize for the metric, usually at the expense of the goal.
The Historical Example:
In colonial India, the British government wanted to reduce the number of venomous cobras. They offered a bounty for every dead cobra brought in.
The Result: The locals began farming cobras to collect the bounty. When the British realized this and cancelled the program, the farmers released the cobras. The cobra population increased.
The Engineering Equivalent:
- The Goal: Increase developer productivity.
- The KPI: Number of Code Commits per day.
- The Result: Developers break one feature into 10 tiny commits. They stop thinking deeply and start typing furiously. You have high activity, but zero progress.
The Lesson: Never incentivize the output (commits); incentivize the outcome (features shipped).
2. The McNamara Fallacy (Ignoring the Unmeasurable)
Robert McNamara, the US Secretary of Defense during the Vietnam War, was a data obsessional. A former President of Ford, he believed everything in the world could be managed by a spreadsheet.
He managed the war by the numbers: Body Counts, Ammunition used, Supply chains.
The data said the US was winning. The reality was they were losing.
Why? Because he ignored what he couldn't measure: Morale and Willpower.
This is the McNamara Fallacy:
- Measure whatever can be easily measured.
- Disregard that which cannot be measured.
- Presume that which cannot be measured is not important.
The Corporate Equivalent:
We obsess over Conversion Rate (easy to measure) but ignore Brand Sentiment (hard to measure). We aggressively optimize a landing page with pop-ups to get +0.5% conversion, ignoring that we just annoyed 99.5% of visitors who will never come back.
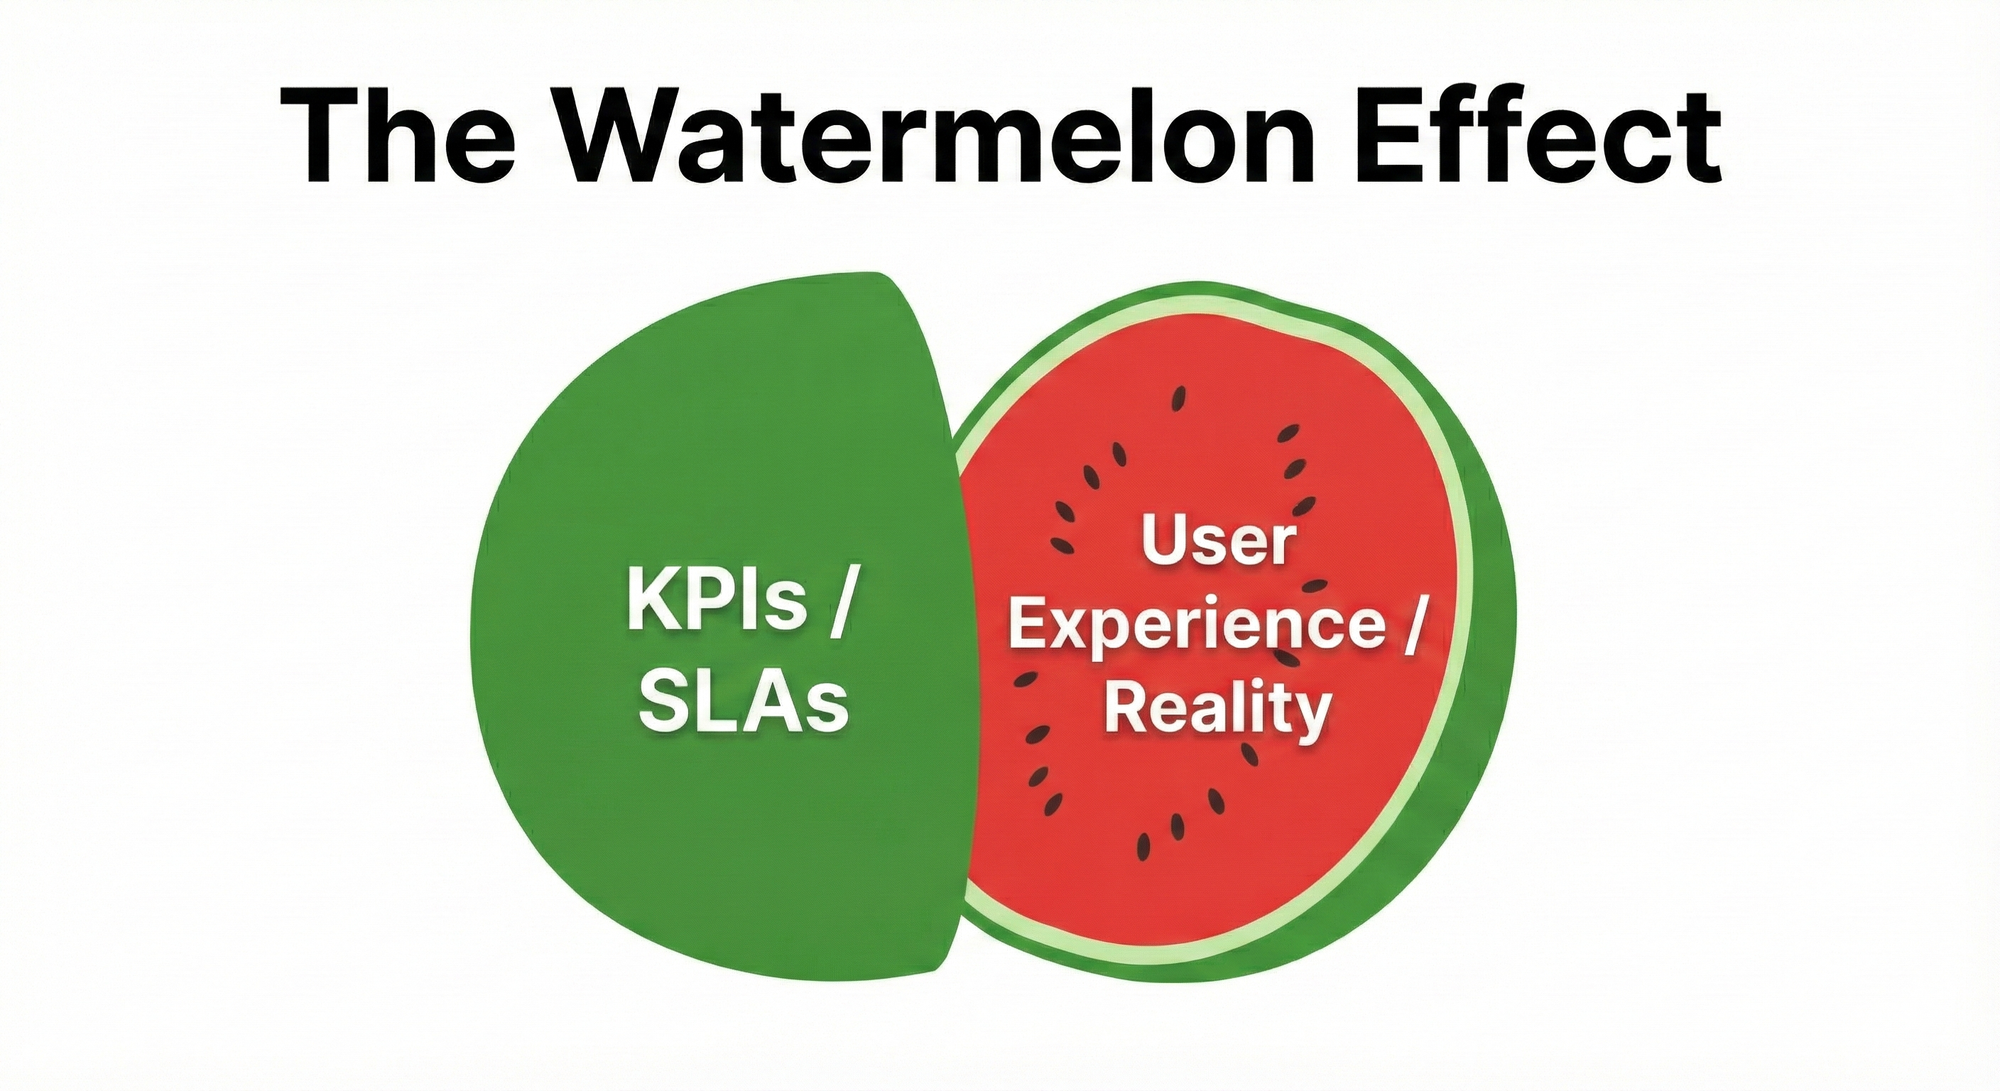
3. The Watermelon Effect (Green on the Outside, Red on the Inside)
This is common in Service Level Agreements (SLAs).
- The Dashboard: "99.9% Uptime" (Green).
- The Customer: "The site is unusable." (Red).
How?
The server was technically "Up" (responding to pings), but the database was locked, so users couldn't log in. Or the site loaded in 0.5 seconds, but the "Buy" button was broken.
A "Watermelon Metric" satisfies the contract but fails the user. It is a metric designed to keep the vendor safe, not the customer happy.
4. The Antidote: Genchi Genbutsu
How do you fight Forged Reality? You cannot fix it with more data. You fix it with Qualitative Sampling.
Toyota uses the principle of Genchi Genbutsu ("Go and See").
If a factory line shows a red light, the manager does not look at a spreadsheet. They walk down to the shop floor and look at the machine.
The Executive Protocol:
- Eat your own Dog Food: Do not read the "Customer Support Report." Go handle 5 support tickets yourself once a month.
- The "Mystery Shopper": Try to buy your own product using a new credit card and a slow 4G connection.
- Talk to the Leavers: Don't ask the managers why people are quitting. Ask the engineers who just quit.
Summary
Data is essential, but data is a compression of reality. In every compression, there is loss.
Your job as a leader is not to optimize the dashboard. Your job is to ensure the dashboard reflects the truth.
When your VP of Sales says "The pipeline is strong," but you haven't closed a deal in 2 months—stop looking at the Salesforce report.
Go look at the territory.
No spam, no sharing to third party. Only you and me.


Member discussion